TIS 2019
Session 20 – Road Safety Assessment and Measures
The argument are different about road safety assessment and measures, in this session a speakers from different countries did present more specific topics like stiffness of passengers cars and analysis on visibility from driver seat with chairperson Davide Lo Presti.
Vasiliki Amprasi, Ioannis Politis, Andreas Nikiforiadis and Socrates Basbas- Comparing the microsimulated pedestrian level of service with the users’ perception: The case of Thessaloniki, Greece, coastal front / Nowadays, there is a keen interest among societies to improve the quality of life of residents by promoting sustainable means of transport like walking and cycling. Towards this direction, it is important to provide a safe, comfortable and attractive environment for the vulnerable road users (pedestrians, cyclists). This should be reflected both in the objective depiction of the current situation as well as in the subjective viewpoint of the users as it is not unusual that these two dimensions of pedestrian infrastructure assessment (objective vs subjective, calculated vs perceived) differ. Focusing on the abovementioned issue, field measurements were carried out on the coastal front of Thessaloniki, second largest city in Greece, by filming the actual prevailing conditions at three points of the study area simultaneously, in order to calculate the level of service “before, during and after the peak”. The modelling of these three-time periods was performed using the microsimulation software Viswalk in 3 different points. From the microsimulation, a number of indices were derived which can give an objective estimation of the walking condition in the examined walkway such as the level of service, the average density, etc.
In addition, a questionnaire-based survey was conducted to capture the satisfaction and sense of comfort and safety that pedestrians perceive while using the infrastructure. The analysis led to interesting conclusive remarks as, despite the very good level of service that was calculated through the simulation models, a significant percentage of users stated that they feel uncomfortable and unsafe when walking along the old and the new waterfront. Main results of simulation give a coincide with literature values, speed of individuals and groups. Main results of pedestrians’ perception are 91% of the respondents use the coastal front for leisure and recreation; 38% of the respondents feel unsafe and 45% of them uncomfortable when walking on the study area. Large number of conflicts with bicycles and inadequate geometry were in most important problems on the study area.
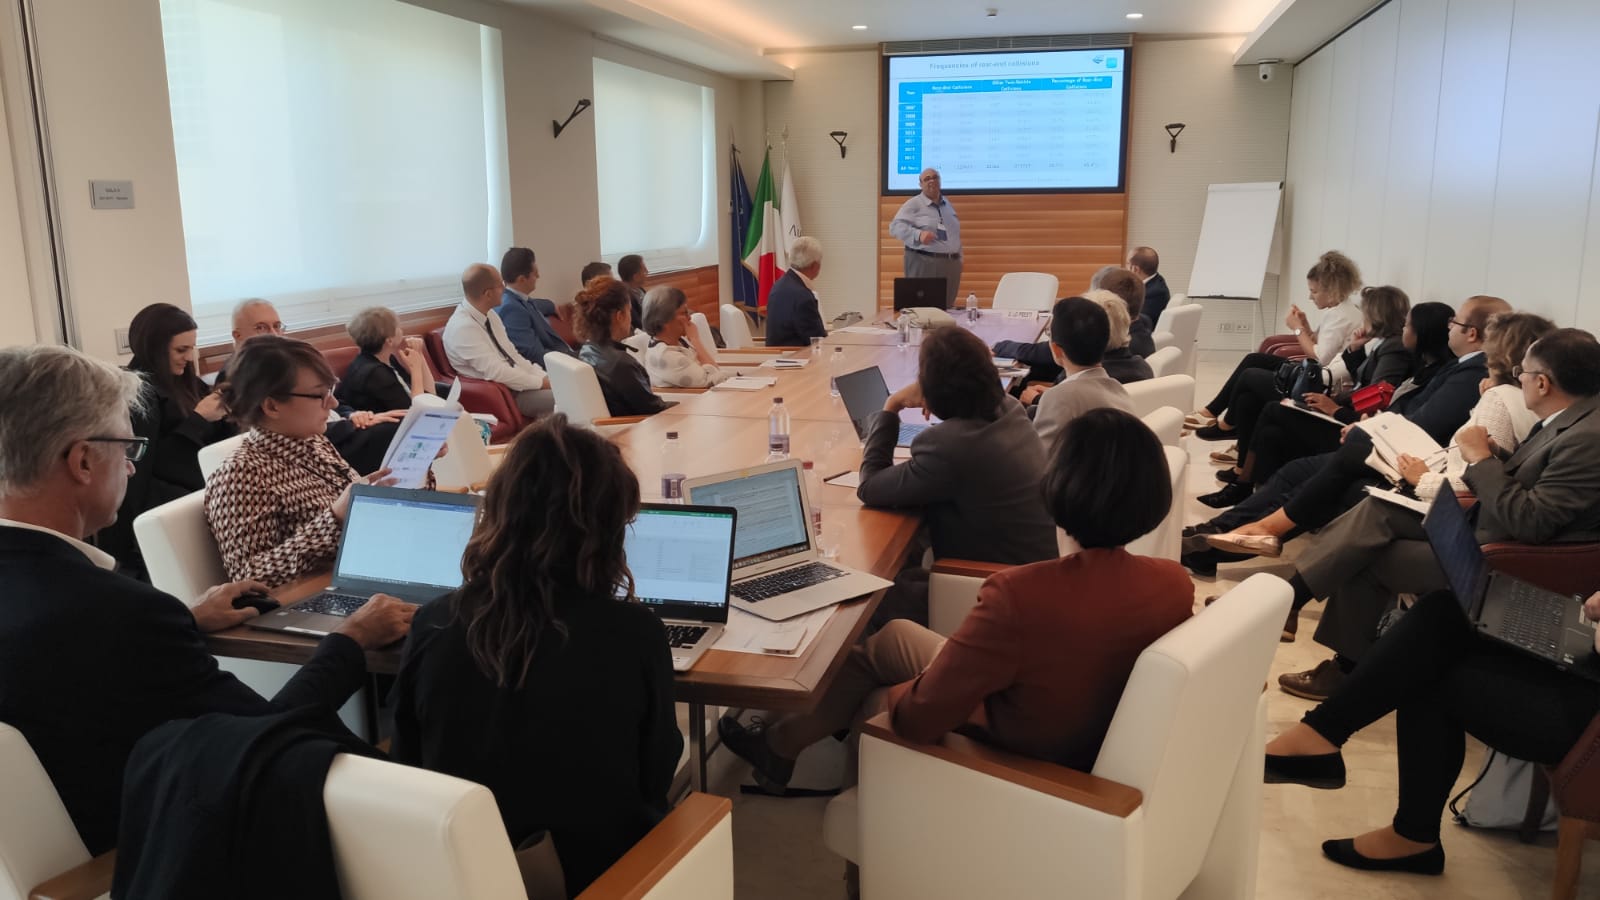
Essam Dabbour and Abdallah Badran- Exploring the factors that increase the severity of rear-end collisions / Rear-end collisions are the most common type of collisions on roadway links and they usually result in severe injuries. Previous research studies identified several factors that may increase the frequency and/or the severity of rear-end collisions. However, most of those previous studies were based on analyzing collision reports from several years and combining them into a single dataset for analysis. Analyzing pooled data from several years carries the risk of introducing aggregation bias in the analysis. Risk factors identified using that approach might have been significant at the time of the analysis, but their significance might change afterward due to the ongoing changes in vehicle technologies, driver behavior, traffic volumes, road conditions, law-enforcement technologies, and implemented policies. Thus, understanding the temporal stability trends of the factors influencing injury severity in rear-end collisions would help researchers in evaluating the effectiveness of implementing different safety treatments so that researchers could understand whether any safety improvements, observed after applying a certain safety treatment, are attributed to the specific treatment or simply attributed to the temporal instability of the factors being addressed. This study investigates the temporal stability of the factors that increase injury severity of rear-end collisions. The research is based on utilizing ordinal regression modeling to analyze all rear-end collisions that occurred in North Carolina for the period from January 1, 2007 to December 31, 2014. An ordered logit models was developed for each year, and the models were compared together to identify the most temporally-stable factors that increase the severity of rear-end collisions. The findings of this research have the potential to help decision makers develop policies and countermeasures that improve roadway safety by focusing on risk factors that consistently increase the severity of rear-end collisions.
Francesco Saverio Capaldo and Daiva Žilionienė-Stiffness of passenger cars: a class analysis / The traffic flows increase on the roads causes the consequent, and fortunately not directly proportional, increase of traffic accidents. The study of the road safety deals how to reduce the incidental phenomenon to non-pathological levels; to be able to operate correctly many different information are needed. Forthe different levels of investigation of the phenomenon only the incidental statistics may be necessary. To plan the interventions, the aggregated data statistics are inadequate and to be replaced by information on the individual incidents that occur in some areas. Each incident can have some execution characteristics that are repeated in a non-random manner and these recurrences must be highlighted and studied in order to obtain effective countermeasures.
The study methods of information on the road accidents may be not only on their typology and imply the possibility of a reconstruction, even if approximate, of the incidental event and its temporal phases of development. In some cases it may also be necessary to evaluate the impact speed between vehicles. Some incident reconstruction techniques allow to obtain reliable speed values before the impact starting from the evidences left on the roadway. If these are not present, it is possible to use methodologies that provide speed values starting from the deformations of the vehicles as relationship to the structural stiffness coefficients. Many databases are available that concerning the coefficients obtained for a large number of passenger cars and others concerning sister cars: these can be used with a good degree of approximation in forensicl consultancy works. A road safety engineer may not need values with high degree of approximation but may wish to proceed more quickly with some coefficients of stiffness that are not exactly those obtained for a single model of car but only for a car that has similar characteristics , not equal, to the full advantage of the speed of accident reconstruction.
In the work, different stiffness coefficients for passenger cars were analyzed and grouped for displacement classes, length and pitch.
Francesco Saverio Capaldo, Francesco Guzzo and Gennaro Nasti-Some analysis on visibility from driver seat / Abstract: Many experimental surveys allow analysts to know the behavior of the drivers. This is conditioned by mental state, momentary emotions, surrounding environment (vehicle, road, weather, traffic). Several studies have been conducted on the interaction between drivers and the environment, as well as other studies investigated some psychological aspects. Vehicles have been improved over the time and manufacturers adapted car safety features to the current needs of the people. Just structural needs led to different designs of passenger car frames. The present paper search the problem of how much the structural elements present in the passenger compartment of a car can be an obstacle to the visibility conditions from driver seat.
The survey was conducted on about 500 cars produced between the years 2007 and 2016. They were divided into displacement classes and for each class the angles of free and obstructed vision from seat were determined in the direction of travel, on the right and left. The classes of displacement of the cars investigated were weighed according to the actual presence of each of them in the Italian car fleet. The obtained results were used for the control of some driving situations typical of crossings at grade and the verification of the actual safety conditions and to show how these distances changed in the years.
At end, the obtained measurements were used to calculate the actual visual possibilities for drivers approaching at a level intersection with different geometrical configurations, angles and with different speeds.
Antonino Tripodi, Edoardo Mazzia, Francisco Reina, Sara Borroni, Paola Tiberi and Mattia Fagnano– A simplified methodology for road safety risk assessment based on automated video image analysis / To support the assessment of road safety risks on the primary roads, the World Bank asked for piloting a new simplified methodology to quickly identify critical sections and at low cost even without sufficient road traffic crash database.
The objective was the development of a methodology for road safety assessment based on the automated analysis of video images. The methodology was tested and validated through an assessment of 500 km of National Highways in Mozambique.
The methodology is based on the common definition of Risk given by the combination of Danger, Vulnerability and Exposure. Various road attributes associated with Crash Modification Factors are considered to calculate these factors.
Three road user categories are considered (motor-vehicles, cyclists and pedestrians) and Danger and Vulnerability scores are calculated for each for over 100m road section. In addition, a Global Risk Score (GRS) is also calculated in order to consider pedestrian and cyclist flows.
Risk levels are categorized so that:
• for pedestrians and cyclists, risk varies with the motor-vehicles’ flow speed;
• for the motor-vehicles and for GSR, risk intervals are fixed.
A software solution was implemented allowing to:
• automatically recognise road attributes from video images;
• calculate road users’ risks and the GRS according to the simplified methodology;
• provide outputs on assessed risks (every 100m) both graphically and through table values;
• download all the computed outputs for further analysis.
The software solution works with few inputs such as a video of the road to be assessed, an output file from an free App for assessment of road surface conditions, an image of a calibration sheet and few road attributes to be inputted manually.
A survey of about 500 km of National Highways was performed in Mozambique and other counties in August and September 2018. Risk assessment performed using the simplified methodology and the software for automated video analysis are discussed in the paper. A experiment costed just 200€ so it’s help to do some analysis for the poor countries and they send back a results.
Considerations are that the set of road attributes is limited because : not all the attributes can be automatically recognised with sufficient reliability and precision, inclusion of some attributes to be collected manually would be high time consuming and reliable CMFs are not always available.
An in-depth analysis of video analysis capabilities and of literature led to the final selection.
Eleonora Meta, Luca Persia, Davide Shingo Usami, Alessia Fava, George Yannis, Stergios Mavromatis, Maria Rosaria Saporito and Anastasia Azarko– Improving road safety knowledge in Africa through crowdsourcing: the African Road Safety Observatory / Africa is the worst performing continent in road safety: the fatality rate, 26.6 per 100.000 inhabitants, is almost three times that of Europe’s and fatalities per capita are projected to double from 2015 to 2030 (WHO, 2015). This is mainly due to the fact that Emerging Economies are experiencing increases in traffic, for which their traffic systems are not sufficiently prepared.
On one hand there is a significant demand for data and knowledge to be used for road safety-related decision making. On the other hand there is a substantial lack of a reliable and detailed knowledge on road casualties in terms of the number of road accidents and fatalities occurring and on the factors leading to road accidents or affecting their consequences.
When official data are poor or missing these could be integrated with other sources. The objective of this paper is to describe the African Road Safety Observatory (African RSO), a participative web portal developed in the field of the “Safer Africa – Innovating dialogue and problems appraisal for a “Safer Africa” project, funded by the European Union’s Horizon 2020 program.
The African RSO combines traditional functions of analyzing and sharing road safety performance data and provide knowledge and information, with the more innovative ones: a Dialogue Platform and the crowdsourcing tool.
The Dialogue Platform is dedicated to experts and stakeholders and aims at encouraging and facilitating a constructive engagement and dialogue on road safety in Africa, producing knowledge to inspire road safety funding, policies and interventions in Africa and providing recommendations to update the African Road Safety Action Plan and the African Road Safety Charter.
The crowdsourcing tool allows African citizens to report and highlight road safety needs, to collect opinions as well as to discuss solutions in their own countries to understand better they needs.
Some preliminary results 21 reports and 14 proposals solutions up to February 2019, and most of the feedbacks are about safer road. There is a cultural issue because they don’t have any traffic education and some of modified vehicles are just part of culture.
Conclusion and next steps : according to the preliminary analysis of crowdsourced data collected, several problems were highlighted in all the five road safety pillars.
CHAIRMAN: Davide Lo Presti